AI productivity dashboard
Productivity Dashboards That Turn Work Data Into Actionable Insights.
Bring activity, projects, tasks, time, and workload into one clear view of what needs attention next.
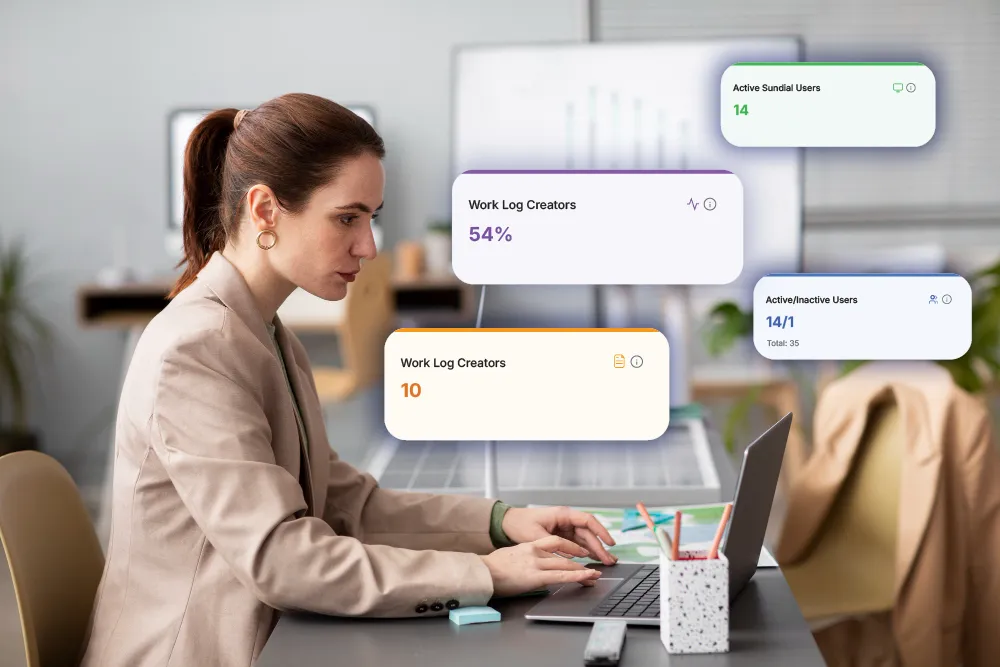
Ralvie product experience
A clear workspace built around the way work actually happens.
Recreated from the supplied Ralvie AI Productivity screens with fresh North American sample data.
Sundial active Capture enabled Search...⋮
WORKFORCE OVERVIEW
Productivity dashboard
September 1-7, 2026
Daily metricsUpdated today
Member rankingTop contributors this week
RankMemberDepartmentScore
Project usage rankingBased on tracked work activity
Explore the flow
Turn live signals into better decisions.
Move from high-level trends into the context behind them, so every productivity conversation starts with a clearer picture.
Live workspaceExplore a connected view
Sundial active Capture enabled Search...⋮
WORKFORCE OVERVIEW
Productivity dashboard
September 1-7, 2026
Daily metricsUpdated today
Member rankingTop contributors this week
RankMemberDepartmentScore
Project usage rankingBased on tracked work activity
Context connected
↗Ready to review
Interaction guide
01Start with the signal+
See the patterns worth attention across people, projects, and time.
02Open the detail+
Follow each trend back to the work context that explains it.
03Plan the next step+
Turn fresh visibility into more useful workload and planning conversations.
Built for clarity Move from a signal to the context behind it without losing your place.
Other core featuresExplore the rest of the connected
Explore the rest of the connected
productivity platform.
Each capability adds a useful layer of context, from captured activity and visual work records to time, tasks, projects, and productivity signals. Together, they help teams move from everyday work to clearer review, planning, and delivery decisions.
Automatic tracking
Capture approved workplace activity and turn it into useful work context.
Explore moreTime logs
Review tracked and logged work together in one clear day.
Explore moreScreen captures
Add authorized visual context within transparent schedules and access boundaries.
Explore moreTasks
Connect work effort with clear ownership, priority, and task progress.
Explore moreProjects
Understand effort, delivery health, and work distribution across initiatives.
Explore moreRalvie AI Productivity
Explore the complete productivity platform for connected work visibility, time intelligence, project delivery, and actionable insights.
Explore moreA clearer way to work
Move from fragmented records to connected work intelligence.
Keep the tools and workflows your team already knows while adding richer workplace context.
How it works
From everyday activity to useful context.
Configure organization and roles
Employees work normally
Activity and work data connect
Dashboard visualizes insights
Teams investigate and act
Context over surveillance
Don’t turn the dashboard into a leaderboard.
A developer, designer, manager, salesperson, and analyst have different work patterns. Dashboard information should support judgment—not replace it.
Avoid simplistic employee rankings
Interpret data with role and complexity
Focus on better decisions and work environments
Frequently asked questions
Productivity dashboards, explained.
Clear answers for a more informed, connected workplace.
What is the Ralvie Productivity Dashboard?
A visual view of workplace activity, projects, tasks, time, applications, workload, and productivity context.
Can managers see team productivity?
Relevant team-level information can be available according to roles and permissions.
Can employees see their own data?
Yes, according to the organization’s configuration.
Can the dashboard show project activity?
Yes. Projects can combine activity, tasks, contributors, time, and context.
How is Dashboard different from Reports?
Dashboard highlights what to notice; Reports provide deeper analysis underneath it.
Does Ralvie rank employees?
No. Productivity should be interpreted with role, complexity, workload, collaboration, quality, progress, and outcomes.
Ralvie AI Productivity
Improve Workforce ProductivityWith Ralvie AI
Ralvie AI Productivity helps businesses improve workforce visibility, automate time tracking, simplify reporting, and gain actionable insights into how teams spend their time through AI-powered productivity management.
Smarter workforce visibility. Less manual reporting. Better productivity decisions.